
The leading national study of CPA firm practice management benchmarks, with guidance for 2024 strategic planning.
“THE barometer for CPA firm practice management.” – AccountingToday
Add the Instant Download PDF to begin benefitting immediately.
$600.00 – $700.00
The leading national study of CPA firm practice management benchmarks, with guidance for 2024 strategic planning.“THE barometer for CPA firm practice management.” – AccountingToday
Add the Instant Download PDF to begin benefitting immediately.TO READ THE FULL ARTICLE
Continue reading your article with a CPA Trendlines Pro membership.
The CPA Industry’s Largest, Most Authoritative Annual Report
By CPAs, For CPAs
WHERE DOES YOUR FIRM RANK?
The Rosenberg MAP Survey is the best-known, most-respected independent study in the profession – for its accuracy, thoroughness, and high participation rate.
HIGHLIGHTS from the 2023 EDITION
TRACKING the TOP TRENDS
Turning Challenges into New Profits and Growth
By Charles Hylan
from the Foreword
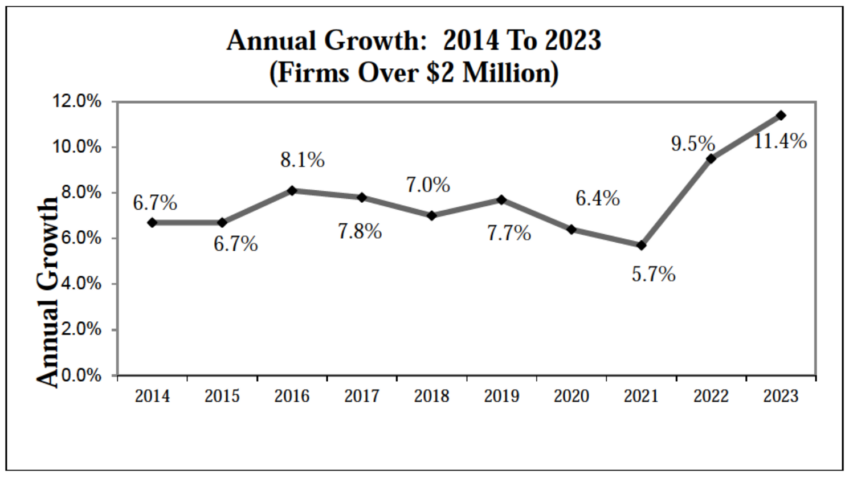
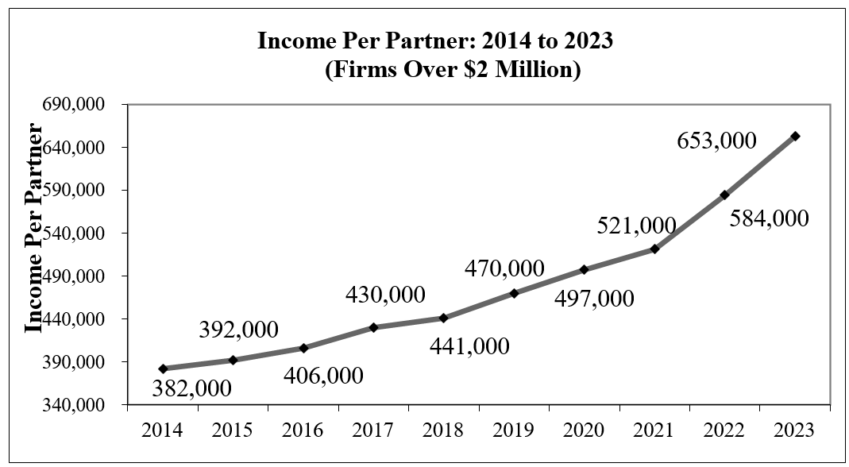
It’s been another amazing year for the accounting profession! But – it comes at a price. As we look at the firms in our survey with revenue greater than $2 million, income per partner was up 11.8%, and revenue was up 11.4%.
This is the second year in which profits grew faster than revenue.
This new revenue and additional profits are occurring amidst a severe staffing shortage, resulting in people being stretched to their limits. So, how do we keep this going at less of a “price tag?” Doing nothing is not an option, and hope is not a strategy. Our profession is experiencing unprecedented pressure from the economy, staffing shortages, technology, and competition.
The list below is nothing new. However, these activities are ramping up in a major way, so we are starting to track new metrics.
1 – Outsourcing/Offshoring/Onshoring: These initiatives continue to grow, and from our experience, they yield tremendous results, including easing some of the staffing issues. That’s not to say that everything is running smoothly, and firms aren’t having to climb over significant learning roadblocks. This is the first year in many where we gathered data in this area. Clearly, many firms are engaging in outsourcing/offshoring/onshoring initiatives and best of all, the vast majority plan to continue or increase their activities. As we look at firms with over $10M in revenue, more than 50% engage in outsourcing activity and nearly 70% plan to do more next year. Of those not outsourcing, 50% plan to start next year.
2 – Client Culling: In the face of staffing shortages, firms got serious about trimming their non-ideal clients. Additionally, firms are paying closer attention to their client acceptance policies. Given the amount of organic growth in the profession and the staffing shortage, it makes sense to cull clients that don’t fit the firm’s ideal to ease the workload and make room for more attractive engagements. Looking at firms >$10M, 51% are actively culling clients, while 45% of firms between $2M and $10M are unloading clients.
3 – Technology: Firms investing in technology are certainly reaping the benefits. Gaining efficiencies through technology is great, but firms are using it to provide advisory services, digitizing all areas of workflow, and virtual collaboration. Consider what our colleague Roman Kepczyk says in the consultants’ comments. Specifically, “The introduction of generative AI (ChatGPT); which most accountants were not even aware of until after busy season created the most significant “buzz” I’ve seen in my career. While easy to address AI early on as “hype,” the speed at which usage has evolved and at which accounting vendors were jumping on board to integrate AI capabilities has been stunning.”
4 – Non-accounting Hires: There aren’t enough CPAs, soon-to-be CPAs, and accounting grads to handle the existing (and growing) workload. As firms move towards more advisory services, they are realizing a lot of the work doesn’t have to be completed by an accounting grad. This has increased the number of firms hiring staff from diverse backgrounds. The more our profession embraces this practice and creates training and processes to support non-accounting hires, the more we can ease the staffing burden.
5 – Advisory Services: Firms investing in advisory services, private equity investing into firms in hopes of growing advisory services, and the overall arguments of why our profession should continue growing advisory services continue to pick up momentum. Even looking at the name of our survey, we’ve realized there may be a need for a change from simply “National Survey of CPA Firm Statistics” to something broader. Nearly 10% of our participants have more than 50% of their revenue driven by non-compliance-related activities.
Finally, as our profession evolves, so must our metrics. Here are just two examples:
6 – Net Firm Billing Rate: The net firm billing rate is derived by dividing net fees by total firm charge hours. However, this metric is becoming less relevant as more firms hire people who bring in and/or manage revenue without charge hours. For example, a firm has a wealth management arm that employs an advisor who doesn’t track charge hours, while a firm with the same revenue doesn’t have a similar position. The first firm will have a higher net firm bill rate simply because of the math. In this example, the net firm billing rate will yield limited insight for firm leadership. As you digest this year’s survey, please be careful when looking at any metric that involves chargeable hours.
7 – Net Fees Per Person: Net fees per person are on the other side of the spectrum. This metric is tremendously insightful for firm leadership. As the profession’s revenue mix changes over the years and firms deploy team members differently, net fees per person are one way to track leverage and ultimately drive profitability. As a result of the staffing shortage, firms are doing everything they can to maximize the “highest and best use” of each of their people, causing the lines to blur between professional and administrative staff. Tracking net fees per FTE has always been valuable; as our profession evolves, it will become even more important.
While these are some trying times in our profession, I believe there are exciting opportunities ahead for firms.
Elite Firm Analysis
For the survey, elite firms were defined as firms with income per partner over $750,000. This year, 22% of firms hit the $750,000 mark.
Below are key observations regarding the differences between elite firms and mainstream firms:
- The average IPP of all 63 elite firms ($1,238,000) is nearly twice the amount of the mainstream average.
- In our analysis of certain statistics and their relationship with income per partner, you will note that leverage is one of the most important driving factors. Leverage can be measured in different ways:
- The staff-to-partner ratio of the elite firms is two vs. the mainstream average of 7.6.
- The net fees per equity partner of the elite firms is $3.5M, the mainstream average of $2.1M.
- The equity partner billing rate of the elite firms is $431, the mainstream average of $375.
- Realization, utilization, and billable hours (stats often discussed in the accounting profession) are similar between elite and mainstream firms.
As is the case every year, leverage and rates are the most influential drivers of income per partner.
METRICS and KPIs for FIRMS of ALL SIZES and REGIONS
CONTENTS
- The Rosenberg Survey: Results at a Glance
- Foreword
- Consultants’ Observations
Detailed Analysis
- Demographics of Survey Participants
- Same Firm Analysis
- Revenue Growth
- Profitability
- Age of the Partners
- Audit Practice Impact on Key Metrics
- Bigger Firms and Profitability
- Bill Rates by Market Size
- Billing Rates of Partners within the Same Population Markets
- Billing Rates: Do Firms with High Rates Have Lower Realization?
- Elite Firms Analysis
- Strategic Plan
- Marketing Plan
- Gender Mix and Percentage of Female Partners
- Financial Services
- Outsourcing
- Managing Partners’ Client Responsibilities
- New Partner Buy-In
- New Partner Compensation
- Non-Equity Partner Position
- Partner Compensation Systems
- Partner Buyout Systems
- Client Retention for Retiring Partners
- Partner Retirement Plans
- Mandatory Partner Retirement
- Profitability Measurement
- Small Cities and Profitability
- Staff Billable Hours
- States: Profitability and Growth for Certain States
- Tax Season Impact on Staff Billable Hours
- The Impact Leverage and Rates Have on Profitability
- Staff-to-Partner Ratio Correlated to Income Per Partner
Methodology
- Definitions and Explanations of Terms
Key Statistics and Ratios
- Firms Over $20 Million in Net Fees
- Firms $10-20 Million in Net Fees
- Firms $5-$10 Million in Net Fees
- Firms $2-$5 Million in Net Fees
- Firms Under $2 Million in Net Fees
- Analysis by 5 Sizes of Firms
- Analysis by 4 Sizes of Population Markets
- Analysis by 4 Geographic Regions of the Country
- Percentile Analysis for Multi-Partner Firms
Raw Data, Firm-by-Firm, Row-by-Row
- Firms Over $20 Million in Net Fees
- Firms $10-20 Million in Net Fees
- Firms $5-$10 Million in Net Fees
- Firms $2-$5 Million in Net Fees
- Firms Under $2 Million in Net Fees
Demographics of Survey Participants
Two hundred ninety-three firms participated in this year’s survey. The breakdown of those firms is as follows:
- 60 firms with annual net fees in excess of $20 million
- 75 firms with annual net fees of $10–20 million
- 100 firms with annual net fees of $5–10 million
- 46 firms with annual net fees of $2–5 million
- 12 firms with annual net fees under $2 million
81% of the firms in our 2023 survey also participated in the 2022 survey.
In terms of the market size (metropolitan population of the county in which the firm resides, plus all collar counties), the firms represent the following:
- 165 firms were from very large cities with a population in excess of two million, such as Chicago, New York, Atlanta, etc.
- 38 firms were from other large cities with populations between one and two million.
- 58 firms were from markets ranging in population between 250,000 and one million.
- 32 firms were from markets of under 250,000.
Regarding geographic dispersion, surveyed firms came from the following areas:
- 88 firms were from Midwestern states (Great Lakes, Dakotas down to Kansas)
- 57 firms were from Northeastern states (New England down to Pennsylvania)
- 105 firms were from Southern states (Kentucky, Delaware, and Maryland down to Florida, as far west as Oklahoma and Texas)
- 43 firms were from Western states (Colorado, New Mexico, Wyoming, Montana, and all states west)
Revenue Growth
Observation
Here is the breakdown of revenue growth by firm size for the past five years:
| 2023 | 2022 | 2021 | 2020 | 2019 | |
| Over $20M |
14.0% |
12.0% | 7.4% | 9.1% |
9.9% |
|
$10-20M |
11.8% | 9.5% | 5.9% | 7.7% |
9.7% |
| $5-10M |
10.7% |
9.5% | 6.0% | 5.1% |
7.0% |
| $2-5M |
8.8% |
7.0% | 2.7% | 5.1% |
4.8% |
|
All firms >$2M |
11.4% | 9.5% | 5.7% | 6.4% |
7.7% |
Because of the large increase in revenue growth this year, we wanted to dig a bit deeper and look at growth by geographic area and market size:
|
Overall Growth |
||
| Size of Market |
2023 |
2022 |
| >2 million |
12.1% |
10.4% |
| 1 – 2 million |
10.8% |
6.6% |
| 250k – 1 million |
11.7% |
7.3% |
| <250k |
7.4% |
6.9% |
Here is the breakdown of growth by region:
|
Overall Growth |
||
| Geographic Region |
2023 |
2022 |
| Midwest |
11.4% |
11.3% |
| Northeast |
10.3% |
9.1% |
| South |
11.5% |
7.0% |
| West |
12.1% |
8.8% |
The Authors
CHARLES HYLAN, CPA
MANAGING DIRECTOR, THE GROWTH PARTNERSHIP
Charles led The Growth Partnership’s (TGP) effort to acquire The Rosenberg Survey from The Rosenberg Associates in 2009 and the INSIDE Public Accounting (IPA) Firm’s Practice Management Surveys in 2022. For many years, TGP has utilized The Rosenberg Survey data for clients, presentations, and thought leadership. Adding the IPA surveys under the TGP umbrella bolsters TGP’s position as the number one source for benchmarking information within the accounting profession.
Charles joined TGP as a Managing Director in 2001 after dedicating 12 years of his career to consulting and working with accounting firms ranging from sole practitioners to national and Big 4 firms. Charles spent over eight years working at Price Waterhouse and Arthur Andersen during this time. He began his career as an auditor at these firms before transitioning into a strategic planning and marketing role. Charles entered the accounting consulting industry in 1999 as a vice president in the Consulting Services division of Waugh & Company.
As a TGP Managing Director, Charles’ passion is to help each client succeed as a business owner. To this end, he is a trusted advisor to clients within several areas of TGP’s service offerings, including marketing, strategic planning, partner compensation, and leadership development.
Charles has been recognized as one of the Top 100 Most Influential People in the accounting profession by Accounting Today, has written articles featured in various accounting publications, and has spoken at many accounting firms, associations, and other industry meetings and conferences.
Designations:
- Certified Public Accountant (Inactive) Memberships:
- American Institute of Certified Public Accountants (AICPA) Education:
- University of Texas at Austin – Bachelor of Arts in Economics
- University of Houston – Master of Business Administration
CAROL STANO, CPA
SENIOR CONTROLLER, THE GROWTH PARTNERSHIP
Carol joined The Growth Partnership (TGP) in 2006. She is responsible for all accounting functions and works closely with the shareholder and management team on accounting matters. Carol is efficient and organized, enabling her to promptly answer questions from clients, business partners, and vendors.
With nearly three decades of experience in the accounting profession, Carol is a valuable asset to the company. Before joining TGP, she was the controller at Drone & Mueller and Associates, a marketing communications business-to-business agency. She also worked as a staff accountant at BKD, LLP, for several years.
Carol provides exemplary customer service, and many participants in The Rosenberg Survey have noted the delight of working with her. Her public accounting and marketing background makes her an ideal fit for managing The Rosenberg Survey.
Designations:
- Certified Public Accountant (CPA)
Education:
- Southwest Missouri State University – Bachelor of Science in Accounting
The Rosenberg MAP Survey: National Study of CPA Firm Statistics [25th Annual Edition]
$600.00 – $700.00
You may also like…
-
 FROM CAS TO CASH
 Client Accounting Services: The Definitive Success Guide
The Why, What, and How of CAS
By Hitendra R. Patil
More than 300 pages of ideas, insights, tips, tricks, and best practices for your CAS success
PLUS – Bonus Downloadable Toolkits (Included FREE with every order)
$439.95 – $459.95 Learn More -
Sale!
 ADVISORY ESSENTIALS
 77 Ways to Wow! The Complete Guide to Small-Business Consulting
By Edward Mendlowitz, CPA
Plus: 125-Item Toolkit, with Fully Customizable, Immediately-Useful Practice Aids
$377.00 – $477.77 Learn More -
 THIS YEAR'S EDITION
 The Accounting Firm Operations and Technology Survey – for Firms of All Sizes
Delivering critical decision-making data to firms of all sizes.
By Randolph P. Johnston and Brian Tankersley
Instant Download PDF eBook
$495.00 Learn More