Rosenberg MAP: Partner Incomes Surge 11.4%

On revenue gains of 11.8%

By Charles Hylan
Rosenberg MAP Survey 

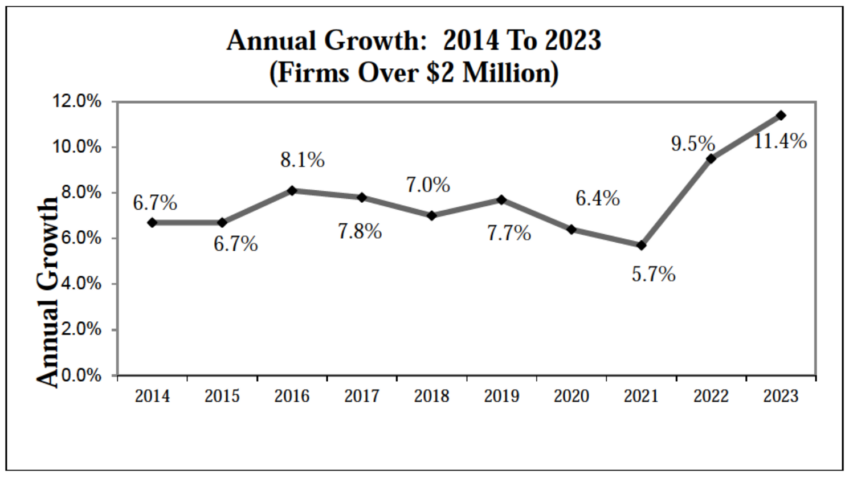
It’s been another amazing year for the accounting profession! But – it comes at a price. As we look at the firms in our survey with revenue greater than $2 million, income per partner was up 11.8%, and revenue was up 11.4%.

MORE in SURVEYS & RESEARCH: Firms Rev Up Expansion Plans | Overcoming the Five Hurdles to Advisory Services | Research: Accounting Pros Cautiously Optimistic about Generative AI | Why Compliance Still Matters. But It’s Not Enough. |  New Businesses Mean New Business | How to Transform Your Team into Trusted Advisors

GoProCPA.comExclusively for PRO Members. Log in here or upgrade to PRO today.

This is the second year in which profits grew faster than revenue.

This new revenue and additional profits are occurring amidst a severe staffing shortage, resulting in people being stretched to their limits.

So, how do we keep this going at less of a “price tag?”

Doing nothing is not an option, and hope is not a strategy.

Our profession is experiencing unprecedented pressure from the economy, staffing shortages, technology, and competition.

The list below is nothing new. However, these activities are ramping up in a major way, so we are starting to track new metrics.

Outsourcing/Offshoring/Onshoring: These initiatives continue to grow, and from our experience, they yield tremendous results, including easing some of the staffing issues. That’s not to say that everything is running smoothly, and firms aren’t having to climb over significant learning roadblocks. This is the first year in many where we gathered data in this area. Clearly, many firms are engaging in outsourcing/offshoring/onshoring initiatives and best of all, the vast majority plan to continue or increase their activities. As we look at firms with over $10M in revenue, more than 50% engage in outsourcing activity and nearly 70% plan to do more next year. Of those not outsourcing, 50% plan to start next year.

Client Culling: In the face of staffing shortages, firms got serious about trimming their non-ideal clients. Additionally, firms are paying closer attention to their client acceptance policies. Given the amount of organic growth in the profession and the staffing shortage, it makes sense to cull clients that don’t fit the firm’s ideal to ease the workload and make room for more attractive engagements. Looking at firms >$10M, 51% are actively culling clients, while 45% of firms between $2M and $10M are unloading clients.

Technology: Firms investing in technology are certainly reaping the benefits. Gaining efficiencies through technology is great, but firms are using it to provide advisory services, digitizing all areas of workflow, and virtual collaboration. Pay close attention to what our colleague Roman Kepczyk says in the consultants’ comments. Specifically, “The introduction of generative AI (ChatGPT); which most accountants were not even aware of until after busy season created the most significant “buzz” I’ve seen in my career. While easy to address AI early on as “hype,” the speed at which usage has evolved and at which accounting vendors were jumping on board to integrate AI capabilities has been stunning.”

Non-accounting Hires: There aren’t enough CPAs, soon-to-be CPAs, and accounting grads to handle the existing (and growing) workload. As firms move towards more advisory services, they are realizing a lot of the work doesn’t have to be completed by an accounting grad. This has increased the number of firms hiring staff from diverse backgrounds. The more our profession embraces this practice and creates training and processes to support non-accounting hires, the more we can ease the staffing burden.

Advisory Services: Firms investing in advisory services, private equity investing into firms in hopes of growing advisory services, and the overall arguments of why our profession should continue growing advisory services continue to pick up momentum. Even looking at the name of our survey, we’ve realized there may be a need for a change from simply “National Survey of CPA Firm Statistics” to something broader. Nearly 10% of our participants have more than 50% of their revenue driven by non-compliance-related activities.

Finally, as our profession evolves, so must our metrics. Here are just two examples:

Net Firm Billing Rate: The net firm billing rate is derived by dividing net fees by total firm charge hours. However, this metric is becoming less relevant as more firms hire people who bring in and/or manage revenue without charge hours. For example, a firm has a wealth management arm that employs an advisor who doesn’t track charge hours, while a firm with the same revenue doesn’t have a similar position. The first firm will have a higher net firm bill rate simply because of the math. In this example, the net firm billing rate will yield limited insight for firm leadership. As you digest this year’s survey, please be careful when looking at any metric that involves chargeable hours.

Net Fees Per Person: Net fees per person are on the other side of the spectrum. This metric is tremendously insightful for firm leadership. As the profession’s revenue mix changes over the years and firms deploy team members differently, net fees per person are one way to track leverage and ultimately drive profitability. As a result of the staffing shortage, firms are doing everything they can to maximize the “highest and best use” of each of their people, causing the lines to blur between professional and administrative staff. Tracking net fees per FTE has always been valuable; as our profession evolves, it will become even more important.

While these are some trying times in our profession, I believe there are exciting opportunities ahead for firms.

Elite Firm Analysis

For the survey, elite firms were defined as firms with income per partner over $750,000. This year, 22% of firms hit the $750,000 mark.

Below are key observations regarding the differences between elite firms and mainstream firms:

  • The average IPP of all 63 elite firms ($1,238,000) is nearly twice the amount of the mainstream average.
  • In our analysis of certain statistics and their relationship with income per partner, you will note that leverage is among the most important driving factors. Leverage can be measured in different ways:
    • The staff-to-partner ratio of the elite firms is two vs. the mainstream average of 7.6.
    • The net fees per equity partner of the elite firms is $3.5M, the mainstream average of $2.1M.
    • The equity partner billing rate of the elite firms is $431, the mainstream average of $375.
  • Realization, utilization, and billable hours (stats often discussed in the accounting profession) are similar between elite and mainstream firms.

As is the case every year, leverage and rates are the most influential drivers of income per partner.

Revenue Growth

Observation

Here is the breakdown of revenue growth by firm size for the past five years:

2023 2022 2021 2020 2019
Over $20M

14.0%

12.0% 7.4% 9.1%

9.9%

$10-20M

11.8% 9.5% 5.9% 7.7%

9.7%

$5-10M

10.7%

9.5% 6.0% 5.1%

7.0%

$2-5M

8.8%

7.0% 2.7% 5.1%

4.8%

All firms >$2M

11.4% 9.5% 5.7% 6.4%

7.7%


Because of the large increase in revenue growth this year, we wanted to dig a bit deeper and look at growth by geographic area and market size:

Overall Growth

Size of Market

2023

2022

>2 million

12.1%

10.4%

1 – 2 million

10.8%

6.6%

250k – 1 million

11.7%

7.3%

<250k

7.4%

6.9%


Here is the breakdown of growth by region:

Overall Growth

Geographic Region

2023

2022

Midwest

11.4%

11.3%

Northeast

10.3%

9.1%

South

11.5%

7.0%

West

12.1%

8.8%