A new tool from CPA Trendlines for benchmarking and strategic decision-making
Accountants Demand Index, 2006-2026
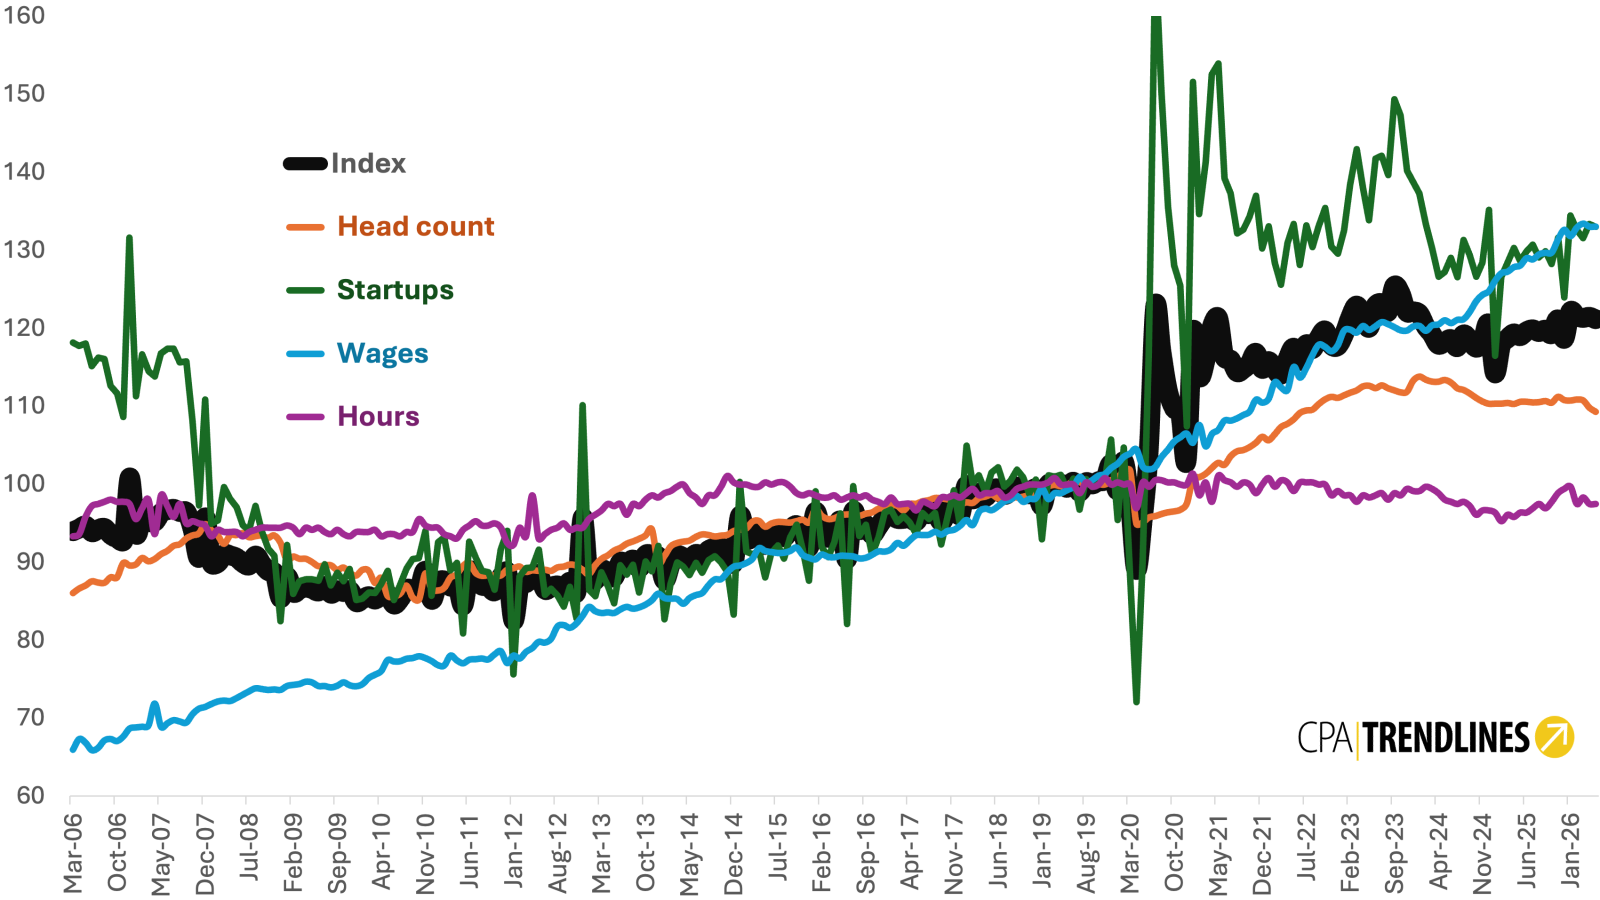
The Index Gives Accounting Firms a Monthly Read on Demand Pressure
Built from business formation, employment, wages and hours, the measure is best understood as a cycle gauge, validated against MAP survey reality.
By CPA Trendlines Research
The accounting profession has long had benchmarking surveys, revenue rankings and busy-season anecdotes. What it has not had is a monthly economic signal that shows whether demand pressure on firms is rising, easing or splitting apart across clients, labor, wages and workload.
MORE The latest Accountants Demand Index
Errors and omissions should be addressed to News1 @ cpatrendlines.com
That is the purpose of the index. It is not a sentiment poll and it is not a promise that any particular firm will grow. It is a composite measure built from four public federal data series, each rebased to a 2019 baseline of 100 and updated monthly as new government data arrive. Its intellectual premise is straightforward: accounting demand is derived from the conditions that create work for accountants.
Businesses create that demand. New employer businesses generate tax, payroll, bookkeeping, compliance and advisory needs. A larger accounting workforce signals capacity being used. Rising pay indicates competition for talent in a labor-intensive service market. Longer workweeks show utilization pressure at the margin. No single series is sufficient. Together, they form a structured measure of the profession’s operating environment.
Why the four components belong together
The index uses four inputs: high-propensity business applications from the Census Bureau and employment, average hourly earnings and average weekly hours from the Bureau of Labor Statistics. The weights reflect the theory behind the measure. Business formation and sector employment each carry 35 percent. Average hourly earnings carry 20 percent. Average weekly hours carry 10 percent.
Business formation receives the largest weight because it is the clearest upstream signal. High-propensity applications are filings that Census models identify as likely to become employer businesses within four quarters. Each such business is a potential source of payroll work, tax work, bookkeeping, financing support and advisory demand. When formations accelerate, future accounting demand usually strengthens. When formations cool, demand pressure can ease even if firms remain busy.
Employment receives equal weight because workload is not the only demand. It is demand relative to capacity. A stable or declining workforce can make a moderate demand environment feel severe. That is why flat employment in the tax and accounting sector becomes important when business formation remains elevated: the pressure does not disappear; it is absorbed by the same people, different processes, outside staffing, automation, price increases, or some combination of all four.
Wages function as a labor-market signal. In the professional services industry, rising hourly earnings are not merely a cost problem. They also show that firms are competing for scarce capacity. Hours worked receive the smallest weight because they are noisier and shorter-term. They still matter, but mainly as a utilization signal rather than as the structural driver of the index.
What the validation work shows
The internal statistical evidence supports the design. On long-run levels and 12-month averages, three of the four components – business formation, employment and wages – correlate with the composite at 0.90 or higher. Hours are weaker, around 0.54 to 0.58, which confirms their lower weight. On month-to-month changes, the pattern changes: business formation supplies the short-run pulse, with a monthly-change correlation of 0.99 to the index.
That distinction matters. The slow-moving labor data give the index its long-run direction. Business formation gives it its turning points. The result is a measure that should not be overread one month at a time. The validation report estimates single-month volatility at about 2.9 index points, enough to make isolated monthly changes unreliable. The safer readings are year-over-year movement and 12-month trends.
The external tests are stronger than a simple internal correlation. Across 17 independent firm-revenue observations spanning 14 calendar years and two survey systems, the index level correlates with reported net-client-fee growth at r = 0.75, with a p-value of 0.0005. The relationship holds after excluding the COVID anomaly year and under rank-correlation testing. Each 10-point rise in the index corresponds to roughly 1.1 percentage points of additional reported revenue growth.
The Rosenberg series provides the stronger time-series test, with a working estimate of r = 0.79 and R-squared of 0.62 against weighted net-client-fee growth from 2011 to 2024. The AICPA MAP evidence is narrower as a time series but useful as a breadth check. From FY2022 to FY2024, the index’s year-over-year signal cooled from positive 0.28 percent to negative 2.72 percent. Rosenberg weighted net-client-fee growth cooled from 11.31 percent to 8.06 percent. AICPA weighted net-client-fee growth cooled from 8.93 percent to 6.35 percent. Every available AICPA size band and region cooled.
That is why the safest public claim is directional accuracy. The index is credible as a demand-pressure gauge. It should not be described as a certified forecast of firm revenue, tax volume or profits. It can support planning, pricing and scenario work, but it does not replace firm-level benchmarking or management judgment.
The workload signal is not the same as output
One of the most useful distinctions in the validation work is the difference between demand pressure and throughput. The index can move in the opposite direction from IRS return volume per worker. That is not a contradiction. Return volume per worker measures output intensity given available labor. The index measures the pressure coming at the profession from the broader economy.
In 2024 and 2025, sector employment peaked and then drifted down while return volume held up. That pushed throughput per worker higher even as some underlying demand-pressure indicators cooled. For practitioners, the distinction is practical. A firm can be doing more work per employee while the broader demand cycle is cooling. It can also face rising demand pressure before that pressure appears in revenue.
What firm leaders can do with it
The index is useful because it gives firm leaders a disciplined way to separate three questions that are often blurred together. Is demand pressure rising or cooling? Is capacity keeping up? Is revenue growth coming from true demand, pricing, productivity, mergers, or mix?
When the index rises while wages rise, it supports a pricing-power argument. When business formation is elevated but employment is flat, it flags capacity strain. When the index cools but revenue remains strong, it raises questions about pricing, realization, service mix and productivity. When the index and firm sentiment diverge, the divergence itself becomes worth investigating.
This is also where the current profession story becomes more important than the number. The index suggests a market that remains busy but constrained. Business formation remains high enough to feed future work. Wages remain elevated enough to show labor-market pressure. Employment is no longer expanding fast enough to absorb demand through traditional hiring. Weekly hours do not provide a durable solution. The adjustment mechanism is therefore shifting toward productivity.
That means technology, workflow redesign, client selection, offshore staffing, price discipline and a different understanding of capacity. The index does not tell firms which strategy will work. It tells them the environment in which those strategies must be judged.
The proper interpretation
The index should be treated as a monthly cycle gauge for the tax and accounting profession. It is serious enough to cite, but not broad enough to answer every question. It has been validated against two decades of economic history and against firm-reported revenue measures. It captures demand pressure, not output. It is national, not local. It is profession-wide, not firm-specific. It is most reliable over year-over-year and 12-month windows, not isolated monthly moves.
That disciplined interpretation is its strength. For years, the profession has relied on surveys and anecdotes to describe what every practitioner could feel: busier seasons, harder hiring, rising wages, more clients needing advice, and uneven capacity. The index gives those conditions a monthly economic frame. It does not replace the profession’s surveys. It gives them a current context.
The Index That Reads the Cycle
Across 17 independent observations of firm-reported revenue spanning 14 calendar years and two survey systems, the ADI level correlates with net client fee growth at r = 0.75 with p = 0.0005. The index has matched the direction of ten of eleven major economic turns over two decades. The ADI is a demand-pressure gauge, not a firm-level revenue forecast, but it is now defensible in print as a validated cycle indicator for the accounting profession.
The Census Bureau’s Business Formation Statistics program tracks high-propensity business applications — filings that statistical models identify as likely to become employer businesses within four quarters. Business formation carries the highest weight because new businesses are the profession’s most reliable leading indicator. Every new employer is a potential audit client, a payroll client, a tax client. When formation rates surged in 2020 and 2021, accounting workloads followed. When they softened, demand eased with them.
BLS employment in the tax and accounting sector carries equal weight. A large, fully employed workforce means capacity is being utilized. When employment rises alongside business formation, the signal is unambiguous: the profession is absorbing new work. When employment plateaus while formations remain elevated, the resulting tension — more work, not enough people — becomes visible in the index.
Wages in a services profession are not just a cost metric; they are a demand signal. When firms are raising pay, it is typically because they are competing for talent to serve clients they already have or expect to have. Wage acceleration preceded the profession’s 2022 and 2023 peak busy-season strain by several quarters.
Hours data carries the lowest weight and for good reason: it is the noisiest of the four series and shows the weakest long-run correlation with the composite. Its role is to capture intensity at the margin — when existing workers are being asked to work longer, it registers a short-term pressure signal, not a structural one.
Internal Structure
On the long-run trend, three of the four components track the composite tightly. Business formation, employment, and wages all correlate with the index at r = 0.90 or higher across the full series from March 2006 through May 2026 (242 monthly observations). Hours is the weak member at r = 0.54 to 0.58 — which is precisely why it carries the lowest weight.
On month-over-month changes, the picture inverts sharply. Business formation dominates the index’s short-run pulse at r = 0.99 monthly and r = 0.97 year-over-year. Employment, wages, and hours barely move the needle at the monthly level. The implication: the ADI inherits its long-run direction from the slow-moving labor data and its short-run turns from new business formations. Monthly volatility runs about 2.9 index points at one standard deviation — too high for single-month turn calls. The trustworthy timescales are year-over-year and 12-month rolling.
Twenty Years of Directional Accuracy
If the ADI is a meaningful cycle indicator, it should register the major economic turns of the past two decades in the right direction. Across eleven explicit directional tests against known events, ten match expectations.
The index fell during the 2008–2009 financial crisis. It rose modestly during 2020, reflecting the surge in PPP and CARES Act work that offset lockdown drag. It spiked in 2021 with the Great Resignation and the business-formation boom. It peaked at 122.28 in 2023 — the year firms most loudly reported busy-season strain — and cooled in 2024 as the cycle softened, matching what Busy Season Barometer respondents were reporting in real time. The single miss is 2010, when the index fell another half-point even though the technical recovery was underway. That is a margin call, not a directional failure.
| Year | Condition | Expected | ADI Direction | Result |
|---|---|---|---|---|
| 2008 | Financial crisis begins | Down | Down (?5.67) | Match |
| 2009 | Recession trough | Down | Down (?3.18) | Match |
| 2010 | Recovery should begin | Up | Down (?0.46) | Miss |
| 2018 | TCJA implementation | Up | Up (+3.00) | Match |
| 2020 | COVID + PPP/CARES surge | Up | Up (+5.17) | Match |
| 2021 | Great Resignation, BFS surge | Up | Up (+11.44) | Match |
| 2022 | Inflation, wage spiral | Up | Up (+0.32) | Match |
| 2023 | Peak busy-season strain | Up | Up (+5.36) | Match |
| 2024 | Cooling cycle begins | Down | Down (?3.33) | Match |
| 2025 | Continued cooling | Down | Down (?0.05) | Match |
External Validation Against the MAP Surveys
The strongest test of the ADI is whether it tracks revenue growth as actually reported by accounting firms. Two surveys provide that test: the AICPA PCPS MAP biennial and the Rosenberg MAP/National Survey annual. Both ask firms to report year-over-year change in net client fees, but they use different methodologies. Rosenberg reports a firm-count-weighted average; AICPA reports firm-level medians. AICPA’s approach is more robust to outlier firms; Rosenberg runs about one to two percentage points hotter on average. Despite that methodological gap, both surveys land on the same scatter against the ADI.
Combined Dataset: 17 Observations Across 14 Years
The Rosenberg archive yielded 12 matched data years (2011, 2013, 2014, 2016, 2017, 2018, 2019, 2020, 2021, 2022, 2023, 2024). The AICPA archive yielded five additional years not covered by Rosenberg’s middle-band cleanup (2011, 2013, 2015, 2022, 2024). Combined, the validation set carries 17 independent observations against the ADI level. Each ten-point rise in the ADI corresponds to roughly 1.1 percentage points of additional reported fee growth.
| Comparison | r | p-value | n | Reading |
|---|---|---|---|---|
| Combined Rosenberg + AICPA vs ADI level | 0.751 | 0.0005 | 17 | Strong, highly significant |
| Combined, excluding 2020 (COVID) | 0.792 | 0.0003 | 16 | Stronger without pandemic anomaly |
| Combined Spearman rank (?) | 0.709 | 0.0014 | 17 | Robust to linear assumption |
| Rosenberg only | 0.788 | 0.0024 | 12 | Longest single-survey series |
| AICPA only | 0.749 | 0.146 | 5 | Same magnitude, smaller n |
| Pre-2020 era | 0.651 | 0.041 | 10 | Significant in the pre-pandemic period |
| Post-2020 era | 0.634 | 0.127 | 7 | Same magnitude, smaller n |
The 2022–2024 Reality Check
The FY2022-to-FY2024 cooling cycle provides the clearest contemporaneous test. Rosenberg weighted NCF growth cooled from 11.31% to 8.06%, nearly matching the ADI’s movement in magnitude. AICPA weighted fee growth cooled from 8.93% to 6.35%, a directional confirmation across 7 of 7 available size bands and all 4 regions surveyed.
| Metric | FY2022 | FY2024 | Change | Interpretation |
|---|---|---|---|---|
| ADI YoY | +0.28% | ?2.72% | ?3.00 pts | Demand pressure cooled |
| Rosenberg weighted NCF growth | 11.31% | 8.06% | ?3.25 pts | Revenue growth cooled nearly point-for-point |
| AICPA weighted NCF growth | 8.93% | 6.35% | ?2.59 pts | Directional confirmation |
| AICPA size bands cooling | — | 7 of 7 | All bands | Broad size-band confirmation |
| AICPA regions cooling | — | 4 of 4 | All regions | Broad geographic confirmation |
The IRS Throughput Divergence Is a Feature
Comparing the ADI to IRS individual returns received per NAICS 5412 worker produced an apparent puzzle: from 2023 to 2025, ADI declined while returns-per-worker rose. The series moved in opposite directions.
That divergence is the right divergence. The ADI is a demand-pressure index — what is coming at the profession. Returns-per-worker is throughput intensity — workload divided by available labor. In 2024 and 2025, NAICS 5412 employment peaked and then drifted down. Fewer workers absorbing similar return volume drives returns-per-worker up even as the underlying demand pressure was easing. The two metrics tell different stories from the same underlying data, and a reader who treats them as the same will reach the wrong conclusion.
| Year | ADI Jan–Apr avg | IRS Returns/Worker | NAICS 5412 Emp (000s) | Status |
|---|---|---|---|---|
| 2023 | 121.27 | 119.85 | 1,144.3 | Final |
| 2024 | 119.80 | 121.47 | 1,145.4 | Final |
| 2025 | 117.52 | 124.74 | 1,127.4 | Final |
| 2026 | 121.66 | 118.60 | 1,129.9 | Provisional |
2026 figure preliminary from Bisignano Senate Finance testimony, April 15, 2026.
What the Index Is For — and What It Is Not
Use the ADI for:
Reading the cycle. Direction and magnitude of year-over-year change anchor a story about whether demand pressure is rising or easing across the profession.
Cross-referencing with sentiment. When ADI direction matches Busy Season Barometer mood, the reading is reinforced. Divergence is itself a story.
Comparing recoveries. The 2009 trough, 2020 dip, and 2024 cooling can be set side by side because the index is rebased to a common 2019 baseline.
Component decomposition. When ADI moves, the four-component breakout shows whether the story is business formation, employment, wages, or hours.
Planning and pricing context. When ADI rises while wages rise, it supports a pricing-power argument. When ADI cools, firms should be more cautious about fee increases unless their niche demand is stronger than the market.
Do not use the ADI for:
Forecasting individual firm revenue. The index measures profession-wide pressure, not firm-level workload. A firm growing 15% in a year, the index reads flat, is not contradicting the index — it is outperforming a trend.
Predicting IRS return volume. The IRS workload proxy is a separate metric that can move opposite to ADI when employment is the dominant variable.
Single-month decisions. Monthly volatility (about 2.9 points one-standard-deviation) is too high; the year-over-year and 12-month rolling readings are the trustworthy ones.
Geographic or firm-size segmentation. The index is national and profession-wide.
Replacing the MAP surveys. AICPA and Rosenberg capture firm-level realities — staffing ratios, compensation benchmarks, partner income — that no macroeconomic composite can reach. The ADI is a higher-frequency complement to those surveys, most useful in the months between biennial and annual publications.
Component Index Data Table
Monthly, March 2006 – May 2026 · Index levels (Base 2019 = 100) and year-over-year % change
Composite |
Head Count |
Startups |
Salaries |
Hours |
||||||
|---|---|---|---|---|---|---|---|---|---|---|
Level |
YoY% |
Level |
YoY % |
Level |
YoY % |
Level |
YoY % |
Level |
YoY % |
|
Mar 2006 |
94.0 |
— |
86.0 |
— |
118.1 |
— |
65.9 |
— |
93.3 |
— |
Apr 2006 |
94.3 |
— |
86.6 |
— |
117.7 |
— |
67.3 |
— |
93.6 |
— |
May 2006 |
94.7 |
— |
87.0 |
— |
118.0 |
— |
66.8 |
— |
95.8 |
— |
Jun 2006 |
93.8 |
— |
87.5 |
— |
115.2 |
— |
65.9 |
— |
97.2 |
— |
Jul 2006 |
94.2 |
— |
87.4 |
— |
116.2 |
— |
66.1 |
— |
97.4 |
— |
Aug 2006 |
94.4 |
— |
87.3 |
— |
116.1 |
— |
67.1 |
— |
97.7 |
— |
Sep 2006 |
93.5 |
— |
88.1 |
— |
112.6 |
— |
67.3 |
— |
98.0 |
— |
Oct 2006 |
93.1 |
— |
88.0 |
— |
111.6 |
— |
67.0 |
— |
97.7 |
— |
Nov 2006 |
92.8 |
— |
89.9 |
— |
108.6 |
— |
67.6 |
— |
97.7 |
— |
Dec 2006 |
100.9 |
— |
89.6 |
— |
131.6 |
— |
68.6 |
— |
97.4 |
— |
Jan 2007 |
93.6 |
— |
89.7 |
— |
111.2 |
— |
68.8 |
— |
95.5 |
— |
Feb 2007 |
96.0 |
— |
90.5 |
— |
116.7 |
— |
68.9 |
— |
96.9 |
— |
Mar 2007 |
95.2 |
+1.3% |
90.1 |
+4.7% |
114.5 |
-3.1% |
69.0 |
+4.7% |
98.0 |
+5.0% |
Apr 2007 |
95.2 |
+0.9% |
90.4 |
+4.4% |
113.8 |
-3.3% |
71.8 |
+6.8% |
93.6 |
+0.0% |
May 2007 |
96.4 |
+1.7% |
91.0 |
+4.6% |
116.8 |
-1.1% |
68.9 |
+3.1% |
98.6 |
+2.9% |
Jun 2007 |
96.7 |
+3.0% |
91.4 |
+4.5% |
117.4 |
+1.9% |
69.3 |
+5.2% |
97.2 |
+0.0% |
Jul 2007 |
96.8 |
+2.8% |
92.1 |
+5.4% |
117.4 |
+1.0% |
69.7 |
+5.4% |
95.8 |
-1.7% |
Aug 2007 |
96.4 |
+2.2% |
92.3 |
+5.7% |
115.6 |
-0.4% |
69.5 |
+3.6% |
97.4 |
-0.3% |
Sep 2007 |
96.4 |
+3.1% |
93.0 |
+5.6% |
115.7 |
+2.8% |
69.4 |
+3.1% |
95.0 |
-3.1% |
Oct 2007 |
94.2 |
+1.2% |
93.4 |
+6.1% |
108.1 |
-3.1% |
70.5 |
+5.1% |
95.2 |
-2.5% |
Nov 2007 |
90.6 |
-2.4% |
93.7 |
+4.2% |
97.2 |
-10.5% |
71.2 |
+5.3% |
95.0 |
-2.8% |
Dec 2007 |
95.8 |
-5.1% |
94.9 |
+5.9% |
110.9 |
-15.8% |
71.4 |
+4.0% |
94.7 |
-2.8% |
Jan 2008 |
89.8 |
-4.1% |
94.1 |
+4.9% |
94.9 |
-14.7% |
71.8 |
+4.4% |
93.3 |
-2.3% |
Feb 2008 |
89.9 |
-6.3% |
93.4 |
+3.2% |
95.3 |
-18.3% |
72.1 |
+4.7% |
94.1 |
-2.8% |
Mar 2008 |
91.0 |
-4.4% |
92.4 |
+2.5% |
99.6 |
-13.0% |
72.2 |
+4.7% |
93.9 |
-4.2% |
Apr 2008 |
90.9 |
-4.6% |
93.4 |
+3.4% |
98.1 |
-13.8% |
72.2 |
+0.4% |
93.9 |
+0.3% |
May 2008 |
90.6 |
-6.0% |
93.5 |
+2.7% |
97.0 |
-16.9% |
72.5 |
+5.3% |
93.9 |
-4.8% |
Jun 2008 |
89.9 |
-7.0% |
93.7 |
+2.5% |
94.7 |
-19.3% |
73.0 |
+5.3% |
93.3 |
-4.0% |
Jul 2008 |
89.6 |
-7.5% |
93.2 |
+1.2% |
94.0 |
-19.9% |
73.4 |
+5.3% |
93.9 |
-2.0% |
Aug 2008 |
90.9 |
-5.8% |
93.3 |
+1.1% |
97.2 |
-15.9% |
73.8 |
+6.1% |
94.1 |
-3.4% |
Sep 2008 |
89.8 |
-6.9% |
93.4 |
+0.4% |
94.0 |
-18.8% |
73.7 |
+6.2% |
94.4 |
-0.6% |
Oct 2008 |
88.9 |
-5.6% |
93.1 |
-0.3% |
91.7 |
-15.2% |
73.6 |
+4.4% |
94.4 |
-0.9% |
Nov 2008 |
88.6 |
-2.1% |
93.4 |
-0.3% |
90.8 |
-6.6% |
73.6 |
+3.5% |
94.4 |
-0.6% |
Dec 2008 |
85.4 |
-10.8% |
92.5 |
-2.5% |
82.4 |
-25.6% |
73.6 |
+3.1% |
94.4 |
-0.3% |
Jan 2009 |
88.1 |
-1.9% |
90.3 |
-4.1% |
92.2 |
-2.8% |
74.1 |
+3.2% |
94.7 |
+1.5% |
Feb 2009 |
86.1 |
-4.2% |
90.7 |
-2.9% |
85.9 |
-9.9% |
74.2 |
+3.0% |
94.4 |
+0.3% |
Mar 2009 |
86.5 |
-5.0% |
90.4 |
-2.1% |
87.5 |
-12.1% |
74.3 |
+2.9% |
93.6 |
-0.3% |
Apr 2009 |
86.7 |
-4.5% |
90.4 |
-3.2% |
87.8 |
-10.5% |
74.6 |
+3.4% |
94.4 |
+0.6% |
May 2009 |
86.6 |
-4.4% |
90.0 |
-3.7% |
87.8 |
-9.5% |
74.6 |
+2.8% |
94.1 |
+0.3% |
Jun 2009 |
86.2 |
-4.1% |
89.5 |
-4.5% |
87.6 |
-7.5% |
74.1 |
+1.5% |
94.4 |
+1.2% |
Jul 2009 |
87.0 |
-2.9% |
89.6 |
-3.9% |
89.7 |
-4.6% |
74.1 |
+0.9% |
93.9 |
+0.0% |
Aug 2009 |
86.0 |
-5.4% |
89.6 |
-4.0% |
87.0 |
-10.5% |
73.9 |
+0.2% |
93.6 |
-0.6% |
Sep 2009 |
86.4 |
-3.7% |
89.0 |
-4.7% |
88.6 |
-5.7% |
74.1 |
+0.6% |
94.1 |
-0.3% |
Oct 2009 |
86.2 |
-3.0% |
89.3 |
-4.1% |
87.6 |
-4.5% |
74.6 |
+1.3% |
93.6 |
-0.9% |
Nov 2009 |
86.4 |
-2.6% |
88.6 |
-5.1% |
89.1 |
-1.9% |
74.2 |
+0.7% |
93.3 |
-1.2% |
Dec 2009 |
84.9 |
-0.6% |
88.3 |
-4.5% |
85.1 |
+3.3% |
74.1 |
+0.6% |
93.9 |
-0.6% |
Jan 2010 |
85.3 |
-3.3% |
89.0 |
-1.4% |
85.3 |
-7.5% |
74.3 |
+0.3% |
93.9 |
-0.9% |
Feb 2010 |
85.7 |
-0.5% |
88.9 |
-2.0% |
86.1 |
+0.2% |
75.1 |
+1.2% |
93.9 |
-0.6% |
Mar 2010 |
85.2 |
-1.5% |
87.3 |
-3.4% |
86.1 |
-1.7% |
75.5 |
+1.6% |
94.1 |
+0.6% |
Apr 2010 |
85.8 |
-1.0% |
88.0 |
-2.7% |
87.2 |
-0.7% |
76.0 |
+1.8% |
93.3 |
-1.2% |
May 2010 |
85.9 |
-0.7% |
85.7 |
-4.8% |
88.9 |
+1.2% |
77.4 |
+3.8% |
93.6 |
-0.6% |
Jun 2010 |
84.6 |
-1.9% |
85.6 |
-4.3% |
85.1 |
-2.8% |
77.2 |
+4.3% |
93.6 |
-0.9% |
Jul 2010 |
85.3 |
-1.9% |
85.9 |
-4.1% |
87.0 |
-3.0% |
77.3 |
+4.3% |
93.3 |
-0.6% |
Aug 2010 |
86.6 |
+0.7% |
87.0 |
-2.9% |
89.2 |
+2.5% |
77.6 |
+5.0% |
93.9 |
+0.3% |
Sep 2010 |
86.5 |
+0.1% |
85.4 |
-4.0% |
90.4 |
+2.0% |
77.7 |
+4.8% |
93.9 |
-0.3% |
Oct 2010 |
86.6 |
+0.5% |
85.2 |
-4.6% |
90.5 |
+3.4% |
77.9 |
+4.5% |
95.5 |
+2.1% |
Nov 2010 |
88.9 |
+2.9% |
88.6 |
-0.1% |
94.0 |
+5.5% |
77.7 |
+4.7% |
94.7 |
+1.5% |
Dec 2010 |
85.2 |
+0.3% |
86.6 |
-2.0% |
85.7 |
+0.7% |
77.3 |
+4.4% |
94.4 |
+0.6% |
Jan 2011 |
87.4 |
+2.5% |
86.4 |
-3.0% |
92.5 |
+8.5% |
76.8 |
+3.3% |
94.4 |
+0.6% |
Feb 2011 |
87.7 |
+2.3% |
86.7 |
-2.5% |
93.2 |
+8.2% |
76.7 |
+2.1% |
93.6 |
-0.3% |
Mar 2011 |
86.9 |
+1.9% |
88.0 |
+0.8% |
88.9 |
+3.3% |
78.0 |
+3.2% |
93.3 |
-0.9% |
Apr 2011 |
87.2 |
+1.6% |
88.4 |
+0.5% |
89.9 |
+3.1% |
77.4 |
+1.8% |
93.0 |
-0.3% |
May 2011 |
84.4 |
-1.7% |
89.5 |
+4.5% |
80.8 |
-9.1% |
77.0 |
-0.5% |
94.1 |
+0.6% |
Jun 2011 |
88.8 |
+5.1% |
89.9 |
+5.0% |
92.6 |
+8.8% |
77.5 |
+0.3% |
94.7 |
+1.2% |
Jul 2011 |
87.7 |
+2.8% |
88.6 |
+3.1% |
90.6 |
+4.0% |
77.5 |
+0.3% |
95.2 |
+2.1% |
Aug 2011 |
87.0 |
+0.5% |
88.3 |
+1.4% |
88.9 |
-0.4% |
77.6 |
+0.0% |
94.7 |
+0.9% |
Sep 2011 |
86.9 |
+0.5% |
88.3 |
+3.4% |
88.7 |
-1.9% |
77.5 |
-0.2% |
94.7 |
+0.9% |
Oct 2011 |
86.3 |
-0.4% |
88.3 |
+3.6% |
86.4 |
-4.5% |
78.1 |
+0.3% |
95.0 |
-0.6% |
Nov 2011 |
88.1 |
-0.9% |
88.3 |
-0.3% |
91.6 |
-2.6% |
78.5 |
+1.1% |
94.4 |
-0.3% |
Dec 2011 |
88.7 |
+4.1% |
89.0 |
+2.9% |
94.0 |
+9.7% |
77.0 |
-0.3% |
92.5 |
-2.0% |
Jan 2012 |
82.5 |
-5.6% |
89.2 |
+3.3% |
75.6 |
-18.3% |
78.0 |
+1.6% |
92.2 |
-2.3% |
Feb 2012 |
87.1 |
-0.6% |
89.4 |
+3.1% |
88.2 |
-5.4% |
77.6 |
+1.2% |
94.4 |
+0.9% |
Mar 2012 |
87.3 |
+0.5% |
88.8 |
+0.8% |
89.2 |
+0.4% |
78.5 |
+0.6% |
93.3 |
+0.0% |
Apr 2012 |
88.0 |
+1.0% |
89.0 |
+0.6% |
89.3 |
-0.7% |
79.0 |
+2.0% |
98.6 |
+5.9% |
May 2012 |
88.4 |
+4.7% |
88.9 |
-0.7% |
91.6 |
+13.3% |
79.7 |
+3.6% |
93.0 |
-1.2% |
Jun 2012 |
86.5 |
-2.7% |
89.0 |
-1.0% |
85.8 |
-7.3% |
79.7 |
+2.8% |
93.6 |
-1.2% |
Jul 2012 |
86.9 |
-1.0% |
88.9 |
+0.3% |
86.6 |
-4.4% |
80.2 |
+3.4% |
94.1 |
-1.2% |
Aug 2012 |
87.0 |
+0.0% |
89.3 |
+1.2% |
85.6 |
-3.6% |
81.7 |
+5.3% |
94.4 |
-0.3% |
Sep 2012 |
86.7 |
-0.3% |
89.4 |
+1.3% |
84.3 |
-5.0% |
81.9 |
+5.7% |
95.0 |
+0.3% |
Oct 2012 |
87.5 |
+1.4% |
89.7 |
+1.6% |
86.8 |
+0.4% |
81.6 |
+4.4% |
94.1 |
-0.9% |
Nov 2012 |
86.2 |
-2.2% |
89.5 |
+1.4% |
82.8 |
-9.6% |
82.1 |
+4.5% |
94.4 |
+0.0% |
Dec 2012 |
95.7 |
+7.9% |
89.0 |
-0.0% |
110.1 |
+17.1% |
83.1 |
+7.9% |
94.4 |
+2.1% |
Jan 2013 |
87.6 |
+6.2% |
88.5 |
-0.9% |
86.4 |
+14.4% |
84.2 |
+8.0% |
95.5 |
+3.6% |
Feb 2013 |
87.7 |
+0.6% |
89.6 |
+0.2% |
85.6 |
-2.9% |
83.7 |
+7.8% |
96.1 |
+1.8% |
Mar 2013 |
89.0 |
+2.0% |
90.4 |
+1.9% |
88.7 |
-0.6% |
83.5 |
+6.4% |
96.6 |
+3.6% |
Apr 2013 |
88.7 |
+0.7% |
90.9 |
+2.1% |
86.9 |
-2.7% |
83.5 |
+5.8% |
97.4 |
-1.1% |
May 2013 |
88.1 |
-0.4% |
91.5 |
+2.9% |
84.7 |
-7.5% |
83.5 |
+4.6% |
97.2 |
+4.5% |
Jun 2013 |
90.0 |
+4.1% |
91.8 |
+3.2% |
89.6 |
+4.4% |
83.9 |
+5.3% |
97.4 |
+4.1% |
Jul 2013 |
89.7 |
+3.3% |
92.4 |
+3.9% |
88.4 |
+2.1% |
84.2 |
+5.1% |
96.1 |
+2.1% |
Aug 2013 |
90.4 |
+3.8% |
92.7 |
+3.7% |
89.6 |
+4.7% |
84.0 |
+2.8% |
97.4 |
+3.2% |
Sep 2013 |
89.2 |
+2.9% |
93.0 |
+4.0% |
86.1 |
+2.1% |
84.2 |
+2.8% |
97.2 |
+2.3% |
Oct 2013 |
90.9 |
+3.9% |
93.4 |
+4.2% |
90.1 |
+3.8% |
84.5 |
+3.6% |
98.0 |
+4.1% |
Nov 2013 |
90.9 |
+5.5% |
94.2 |
+5.2% |
88.8 |
+7.3% |
85.1 |
+3.6% |
98.6 |
+4.4% |
Dec 2013 |
90.7 |
-5.3% |
89.9 |
+1.0% |
92.1 |
-16.4% |
85.9 |
+3.4% |
98.3 |
+4.1% |
Jan 2014 |
87.7 |
+0.1% |
90.8 |
+2.6% |
82.6 |
-4.4% |
85.4 |
+1.4% |
98.8 |
+3.5% |
Feb 2014 |
89.7 |
+2.3% |
92.0 |
+2.7% |
87.3 |
+1.9% |
85.3 |
+1.9% |
99.1 |
+3.2% |
Mar 2014 |
90.9 |
+2.0% |
92.5 |
+2.2% |
90.0 |
+1.4% |
85.3 |
+2.2% |
99.7 |
+3.1% |
Apr 2014 |
90.6 |
+2.2% |
92.6 |
+1.9% |
89.4 |
+2.9% |
84.6 |
+1.3% |
99.9 |
+2.5% |
May 2014 |
90.3 |
+2.6% |
92.8 |
+1.4% |
88.3 |
+4.3% |
85.4 |
+2.3% |
98.8 |
+1.7% |
Jun 2014 |
91.1 |
+1.2% |
93.3 |
+1.5% |
89.9 |
+0.3% |
85.8 |
+2.2% |
98.3 |
+0.8% |
Jul 2014 |
90.7 |
+1.1% |
93.6 |
+1.3% |
88.6 |
+0.3% |
86.0 |
+2.1% |
97.4 |
+1.4% |
Aug 2014 |
91.6 |
+1.3% |
93.5 |
+0.9% |
90.2 |
+0.7% |
87.0 |
+3.6% |
98.6 |
+1.1% |
Sep 2014 |
91.8 |
+2.9% |
93.3 |
+0.3% |
90.8 |
+5.5% |
87.8 |
+4.3% |
98.6 |
+1.4% |
Oct 2014 |
91.7 |
+0.8% |
93.4 |
-0.0% |
90.0 |
-0.1% |
87.8 |
+3.9% |
99.7 |
+1.7% |
Nov 2014 |
91.6 |
+0.8% |
93.5 |
-0.7% |
88.7 |
-0.1% |
88.7 |
+4.2% |
101.0 |
+2.5% |
Dec 2014 |
89.9 |
-0.9% |
94.0 |
+4.6% |
83.2 |
-9.6% |
89.4 |
+4.0% |
100.2 |
+2.0% |
Jan 2015 |
96.0 |
+9.5% |
94.2 |
+3.7% |
100.3 |
+21.4% |
89.5 |
+4.9% |
99.9 |
+1.1% |
Feb 2015 |
93.0 |
+3.6% |
94.3 |
+2.5% |
91.4 |
+4.7% |
89.9 |
+5.4% |
99.9 |
+0.8% |
Mar 2015 |
93.2 |
+2.6% |
95.2 |
+3.0% |
91.0 |
+1.1% |
90.4 |
+6.1% |
99.7 |
+0.0% |
Apr 2015 |
93.7 |
+3.4% |
95.3 |
+2.9% |
91.5 |
+2.3% |
91.8 |
+8.4% |
99.7 |
-0.3% |
May 2015 |
92.2 |
+2.1% |
94.6 |
+1.9% |
88.0 |
-0.4% |
91.4 |
+7.1% |
100.2 |
+1.4% |
Jun 2015 |
93.4 |
+2.5% |
95.0 |
+1.8% |
91.2 |
+1.4% |
91.3 |
+6.4% |
99.9 |
+1.7% |
Jul 2015 |
93.8 |
+3.4% |
95.2 |
+1.7% |
92.1 |
+3.9% |
91.2 |
+6.0% |
100.2 |
+2.8% |
Aug 2015 |
93.2 |
+1.8% |
95.1 |
+1.8% |
90.4 |
+0.2% |
91.2 |
+4.8% |
100.2 |
+1.7% |
Sep 2015 |
94.1 |
+2.5% |
95.1 |
+1.9% |
93.2 |
+2.6% |
91.4 |
+4.2% |
99.7 |
+1.1% |
Oct 2015 |
94.8 |
+3.3% |
95.3 |
+2.0% |
94.8 |
+5.3% |
91.9 |
+4.6% |
98.8 |
-0.8% |
Nov 2015 |
93.5 |
+2.0% |
95.5 |
+2.1% |
91.6 |
+3.2% |
90.9 |
+2.5% |
98.6 |
-2.5% |
Dec 2015 |
91.9 |
+2.2% |
95.1 |
+1.2% |
87.6 |
+5.3% |
90.5 |
+1.3% |
98.8 |
-1.4% |
Jan 2016 |
96.5 |
+0.5% |
96.8 |
+2.8% |
99.1 |
-1.2% |
90.3 |
+0.9% |
98.6 |
-1.4% |
Feb 2016 |
93.8 |
+0.9% |
96.0 |
+1.7% |
91.9 |
+0.6% |
90.9 |
+1.2% |
98.3 |
-1.7% |
Mar 2016 |
93.1 |
-0.1% |
95.5 |
+0.4% |
90.6 |
-0.4% |
90.7 |
+0.3% |
98.3 |
-1.4% |
Apr 2016 |
93.8 |
+0.2% |
95.6 |
+0.4% |
92.5 |
+1.2% |
90.6 |
-1.3% |
98.6 |
-1.1% |
May 2016 |
95.2 |
+3.3% |
96.0 |
+1.5% |
96.2 |
+9.3% |
90.8 |
-0.7% |
98.0 |
-2.2% |
Jun 2016 |
90.4 |
-3.3% |
96.1 |
+1.2% |
82.1 |
-10.0% |
90.8 |
-0.5% |
98.3 |
-1.7% |
Jul 2016 |
96.5 |
+2.9% |
96.1 |
+0.9% |
99.7 |
+8.3% |
90.7 |
-0.5% |
98.6 |
-1.7% |
Aug 2016 |
94.2 |
+1.0% |
96.0 |
+0.9% |
93.3 |
+3.2% |
90.5 |
-0.8% |
98.3 |
-1.9% |
Sep 2016 |
94.8 |
+0.7% |
96.2 |
+1.2% |
94.8 |
+1.7% |
90.5 |
-1.0% |
98.6 |
-1.1% |
Oct 2016 |
93.5 |
-1.3% |
96.4 |
+1.2% |
90.9 |
-4.1% |
90.9 |
-1.0% |
98.0 |
-0.8% |
Nov 2016 |
94.6 |
+1.2% |
96.9 |
+1.5% |
93.2 |
+1.8% |
91.4 |
+0.5% |
97.7 |
-0.8% |
Dec 2016 |
95.7 |
+4.1% |
97.0 |
+2.0% |
96.3 |
+10.0% |
91.3 |
+0.9% |
97.4 |
-1.4% |
Jan 2017 |
96.1 |
-0.4% |
97.3 |
+0.5% |
96.7 |
-2.4% |
91.6 |
+1.4% |
98.3 |
-0.3% |
Feb 2017 |
95.6 |
+1.9% |
97.2 |
+1.3% |
95.1 |
+3.5% |
92.4 |
+1.6% |
97.4 |
-0.8% |
Mar 2017 |
95.5 |
+2.6% |
96.6 |
+1.2% |
95.9 |
+5.8% |
92.1 |
+1.6% |
97.4 |
-0.8% |
Apr 2017 |
95.7 |
+2.0% |
97.5 |
+1.9% |
95.1 |
+2.8% |
92.8 |
+2.4% |
97.4 |
-1.1% |
May 2017 |
95.2 |
-0.0% |
97.5 |
+1.5% |
93.6 |
-2.7% |
93.4 |
+2.9% |
96.6 |
-1.4% |
Jun 2017 |
96.4 |
+6.7% |
97.8 |
+1.8% |
96.3 |
+17.4% |
93.5 |
+3.0% |
97.7 |
-0.6% |
Jul 2017 |
96.2 |
-0.4% |
98.0 |
+2.0% |
95.5 |
-4.2% |
93.5 |
+3.1% |
97.4 |
-1.1% |
Aug 2017 |
96.6 |
+2.6% |
98.2 |
+2.4% |
96.3 |
+3.2% |
93.9 |
+3.8% |
97.2 |
-1.1% |
Sep 2017 |
95.2 |
+0.4% |
98.2 |
+2.0% |
92.2 |
-2.7% |
93.5 |
+3.3% |
98.3 |
-0.3% |
Oct 2017 |
96.5 |
+3.2% |
98.1 |
+1.7% |
95.9 |
+5.5% |
94.0 |
+3.4% |
98.3 |
+0.3% |
Nov 2017 |
97.7 |
+3.3% |
97.9 |
+1.1% |
99.2 |
+6.4% |
94.1 |
+3.0% |
98.6 |
+0.8% |
Dec 2017 |
96.0 |
+0.4% |
97.5 |
+0.5% |
94.7 |
-1.7% |
94.7 |
+3.6% |
98.3 |
+0.8% |
Jan 2018 |
99.9 |
+4.0% |
97.7 |
+0.4% |
104.9 |
+8.5% |
95.4 |
+4.1% |
98.8 |
+0.6% |
Feb 2018 |
98.1 |
+2.6% |
97.6 |
+0.4% |
100.1 |
+5.2% |
94.7 |
+2.5% |
99.4 |
+2.0% |
Mar 2018 |
98.9 |
+3.5% |
98.2 |
+1.6% |
101.1 |
+5.4% |
96.4 |
+4.7% |
98.6 |
+1.1% |
Apr 2018 |
98.3 |
+2.8% |
98.4 |
+1.0% |
99.0 |
+4.1% |
96.8 |
+4.4% |
98.8 |
+1.4% |
May 2018 |
99.3 |
+4.2% |
98.7 |
+1.2% |
101.5 |
+8.4% |
96.6 |
+3.4% |
98.8 |
+2.3% |
Jun 2018 |
99.4 |
+3.2% |
98.2 |
+0.4% |
102.1 |
+6.0% |
97.1 |
+3.9% |
99.1 |
+1.4% |
Jul 2018 |
98.6 |
+2.6% |
98.2 |
+0.2% |
99.7 |
+4.3% |
97.7 |
+4.6% |
98.3 |
+0.8% |
Aug 2018 |
99.0 |
+2.6% |
98.4 |
+0.2% |
100.4 |
+4.2% |
98.0 |
+4.4% |
98.6 |
+1.4% |
Sep 2018 |
99.7 |
+4.7% |
98.3 |
+0.1% |
101.9 |
+10.5% |
98.5 |
+5.3% |
99.4 |
+1.1% |
Oct 2018 |
99.3 |
+2.8% |
98.4 |
+0.3% |
100.9 |
+5.2% |
97.7 |
+4.0% |
99.7 |
+1.4% |
Nov 2018 |
98.7 |
+1.0% |
98.6 |
+0.7% |
98.8 |
-0.4% |
98.1 |
+4.2% |
99.9 |
+1.4% |
Dec 2018 |
99.4 |
+3.6% |
98.8 |
+1.4% |
100.6 |
+6.2% |
98.2 |
+3.7% |
99.9 |
+1.7% |
Jan 2019 |
97.2 |
-2.7% |
99.4 |
+1.8% |
92.9 |
-11.4% |
99.4 |
+4.3% |
99.9 |
+1.1% |
Feb 2019 |
99.9 |
+1.9% |
99.7 |
+2.2% |
101.1 |
+1.1% |
98.1 |
+3.5% |
100.2 |
+0.8% |
Mar 2019 |
100.2 |
+1.3% |
99.9 |
+1.7% |
101.0 |
-0.1% |
98.8 |
+2.5% |
100.8 |
+2.2% |
Apr 2019 |
100.1 |
+1.8% |
99.7 |
+1.4% |
101.2 |
+2.2% |
98.8 |
+2.0% |
99.9 |
+1.1% |
May 2019 |
99.5 |
+0.3% |
99.9 |
+1.3% |
99.2 |
-2.2% |
99.2 |
+2.7% |
99.9 |
+1.1% |
Jun 2019 |
100.3 |
+0.9% |
100.4 |
+2.3% |
100.7 |
-1.4% |
99.6 |
+2.6% |
99.9 |
+0.8% |
Jul 2019 |
99.0 |
+0.4% |
100.3 |
+2.1% |
96.7 |
-3.0% |
100.9 |
+3.3% |
98.8 |
+0.6% |
Aug 2019 |
100.3 |
+1.2% |
100.0 |
+1.6% |
100.7 |
+0.3% |
100.1 |
+2.1% |
100.2 |
+1.7% |
Sep 2019 |
100.0 |
+0.3% |
100.1 |
+1.8% |
99.6 |
-2.2% |
100.5 |
+2.1% |
99.7 |
+0.3% |
Oct 2019 |
100.4 |
+1.1% |
100.0 |
+1.7% |
100.5 |
-0.4% |
101.1 |
+3.4% |
99.9 |
+0.3% |
Nov 2019 |
100.5 |
+1.9% |
100.0 |
+1.4% |
100.6 |
+1.9% |
101.3 |
+3.2% |
100.8 |
+0.8% |
Dec 2019 |
102.6 |
+3.2% |
100.5 |
+1.7% |
105.7 |
+5.0% |
102.1 |
+4.0% |
99.9 |
+0.0% |
Jan 2020 |
99.2 |
+2.1% |
100.8 |
+1.4% |
95.4 |
+2.6% |
102.6 |
+3.2% |
100.2 |
+0.3% |
Feb 2020 |
102.9 |
+3.0% |
101.7 |
+2.0% |
104.7 |
+3.5% |
103.5 |
+5.5% |
99.9 |
-0.3% |
Mar 2020 |
97.4 |
-2.7% |
101.8 |
+1.9% |
88.6 |
-12.2% |
103.9 |
+5.1% |
99.9 |
-0.8% |
Apr 2020 |
89.0 |
-11.0% |
94.9 |
-4.8% |
72.0 |
-28.8% |
104.5 |
+5.7% |
96.9 |
-3.0% |
May 2020 |
95.3 |
-4.3% |
95.1 |
-4.8% |
90.0 |
-9.2% |
102.2 |
+3.0% |
100.2 |
+0.3% |
Jun 2020 |
104.6 |
+4.3% |
95.7 |
-4.6% |
116.5 |
+15.7% |
101.9 |
+2.3% |
99.7 |
-0.3% |
Jul 2020 |
122.8 |
+24.0% |
95.9 |
-4.3% |
167.7 |
+73.4% |
102.2 |
+1.2% |
100.5 |
+1.7% |
Aug 2020 |
117.0 |
+16.7% |
96.2 |
-3.8% |
150.3 |
+49.3% |
103.5 |
+3.4% |
100.5 |
+0.3% |
Sep 2020 |
112.1 |
+12.1% |
96.4 |
-3.7% |
135.5 |
+36.0% |
104.4 |
+3.9% |
100.2 |
+0.6% |
Oct 2020 |
109.7 |
+9.3% |
96.5 |
-3.5% |
128.0 |
+27.4% |
105.5 |
+4.3% |
100.2 |
+0.3% |
Nov 2020 |
108.9 |
+8.4% |
96.7 |
-3.2% |
125.4 |
+24.6% |
106.0 |
+4.7% |
99.9 |
-0.8% |
Dec 2020 |
103.0 |
+0.4% |
97.5 |
-3.0% |
107.4 |
+1.6% |
106.5 |
+4.3% |
99.9 |
+0.0% |
Jan 2021 |
119.5 |
+20.5% |
100.8 |
-0.1% |
151.6 |
+58.9% |
105.3 |
+2.6% |
101.3 |
+1.1% |
Feb 2021 |
113.8 |
+10.5% |
100.9 |
-0.8% |
134.6 |
+28.6% |
107.6 |
+3.9% |
98.6 |
-1.4% |
Mar 2021 |
115.9 |
+19.0% |
101.3 |
-0.4% |
141.3 |
+59.4% |
104.8 |
+0.9% |
100.2 |
+0.3% |
Apr 2021 |
120.2 |
+35.0% |
102.1 |
+7.5% |
152.5 |
+111.7% |
106.4 |
+1.9% |
97.7 |
+0.9% |
May 2021 |
121.3 |
+27.4% |
102.7 |
+8.0% |
153.9 |
+71.0% |
106.9 |
+4.6% |
101.0 |
+0.8% |
Jun 2021 |
116.3 |
+11.1% |
102.5 |
+7.0% |
139.2 |
+19.5% |
108.1 |
+6.1% |
100.5 |
+0.8% |
Jul 2021 |
116.0 |
-5.5% |
103.6 |
+8.0% |
137.3 |
-18.2% |
108.1 |
+5.8% |
100.2 |
-0.3% |
Aug 2021 |
114.4 |
-2.2% |
104.2 |
+8.4% |
132.1 |
-12.1% |
108.4 |
+4.8% |
99.7 |
-0.8% |
Sep 2021 |
114.8 |
+2.4% |
104.4 |
+8.3% |
132.7 |
-2.1% |
108.9 |
+4.3% |
100.2 |
+0.0% |
Oct 2021 |
115.5 |
+5.3% |
104.8 |
+8.5% |
134.2 |
+4.8% |
109.3 |
+3.7% |
99.9 |
-0.3% |
Nov 2021 |
116.9 |
+7.3% |
105.3 |
+8.9% |
137.0 |
+9.2% |
110.8 |
+4.5% |
98.8 |
-1.1% |
Dec 2021 |
114.8 |
+11.4% |
106.1 |
+8.8% |
130.2 |
+21.3% |
110.4 |
+3.7% |
99.9 |
+0.0% |
Jan 2022 |
115.8 |
-3.1% |
105.6 |
+4.8% |
133.0 |
-12.2% |
110.9 |
+5.3% |
100.8 |
-0.5% |
Feb 2022 |
114.7 |
+0.8% |
106.4 |
+5.5% |
128.3 |
-4.7% |
113.1 |
+5.1% |
99.7 |
+1.1% |
Mar 2022 |
114.0 |
-1.6% |
107.4 |
+5.9% |
125.5 |
-11.1% |
112.4 |
+7.2% |
100.5 |
+0.3% |
Apr 2022 |
116.0 |
-3.5% |
107.7 |
+5.5% |
131.0 |
-14.1% |
112.0 |
+5.3% |
100.2 |
+2.5% |
May 2022 |
117.5 |
-3.2% |
108.3 |
+5.4% |
133.4 |
-13.4% |
115.0 |
+7.6% |
99.1 |
-1.9% |
Jun 2022 |
115.8 |
-0.4% |
109.2 |
+6.5% |
128.1 |
-8.0% |
113.7 |
+5.1% |
100.2 |
-0.3% |
Jul 2022 |
117.9 |
+1.7% |
109.5 |
+5.7% |
133.2 |
-3.0% |
114.9 |
+6.2% |
100.2 |
+0.0% |
Aug 2022 |
117.3 |
+2.6% |
109.6 |
+5.1% |
130.4 |
-1.3% |
116.6 |
+7.5% |
100.2 |
+0.6% |
Sep 2022 |
118.7 |
+3.5% |
110.3 |
+5.7% |
133.1 |
+0.3% |
117.9 |
+8.3% |
99.9 |
-0.3% |
Oct 2022 |
119.7 |
+3.6% |
110.9 |
+5.9% |
135.4 |
+0.9% |
117.6 |
+7.6% |
99.9 |
+0.0% |
Nov 2022 |
117.8 |
+0.9% |
111.2 |
+5.6% |
130.5 |
-4.8% |
117.0 |
+5.6% |
98.6 |
-0.3% |
Dec 2022 |
117.7 |
+2.5% |
111.1 |
+4.7% |
129.6 |
-0.5% |
117.8 |
+6.7% |
99.1 |
-0.8% |
Jan 2023 |
119.2 |
+2.9% |
111.4 |
+5.5% |
132.5 |
-0.4% |
119.7 |
+7.9% |
98.6 |
-2.2% |
Feb 2023 |
121.4 |
+5.8% |
111.7 |
+5.0% |
138.4 |
+7.9% |
119.8 |
+6.0% |
98.6 |
-1.1% |
Mar 2023 |
122.9 |
+7.8% |
112.0 |
+4.4% |
143.0 |
+13.9% |
119.4 |
+6.3% |
97.7 |
-2.7% |
Apr 2023 |
121.6 |
+4.9% |
112.6 |
+4.5% |
138.0 |
+5.4% |
120.3 |
+7.3% |
98.6 |
-1.7% |
May 2023 |
120.1 |
+2.2% |
112.6 |
+4.0% |
133.8 |
+0.4% |
119.8 |
+4.1% |
98.3 |
-0.8% |
Jun 2023 |
122.8 |
+6.1% |
112.3 |
+2.9% |
141.8 |
+10.7% |
120.2 |
+5.8% |
98.6 |
-1.7% |
Jul 2023 |
123.2 |
+4.5% |
112.7 |
+2.9% |
142.1 |
+6.7% |
120.8 |
+5.1% |
98.8 |
-1.4% |
Aug 2023 |
122.1 |
+4.1% |
112.3 |
+2.5% |
139.6 |
+7.1% |
120.5 |
+3.4% |
98.0 |
-2.2% |
Sep 2023 |
125.4 |
+5.6% |
112.0 |
+1.6% |
149.3 |
+12.2% |
120.1 |
+1.9% |
98.8 |
-1.1% |
Oct 2023 |
124.5 |
+4.0% |
111.8 |
+0.8% |
147.3 |
+8.8% |
119.7 |
+1.8% |
98.6 |
-1.4% |
Nov 2023 |
122.1 |
+3.6% |
111.9 |
+0.6% |
140.2 |
+7.4% |
119.7 |
+2.3% |
99.4 |
+0.8% |
Dec 2023 |
122.2 |
+3.8% |
113.3 |
+2.0% |
138.7 |
+7.1% |
120.2 |
+2.1% |
99.1 |
+0.0% |
Jan 2024 |
121.8 |
+2.2% |
113.8 |
+2.2% |
137.3 |
+3.6% |
120.3 |
+0.5% |
99.1 |
+0.6% |
Feb 2024 |
120.2 |
-0.9% |
113.4 |
+1.5% |
133.3 |
-3.7% |
119.7 |
-0.1% |
99.7 |
+1.1% |
Mar 2024 |
119.2 |
-3.0% |
113.2 |
+1.0% |
130.3 |
-8.9% |
120.4 |
+0.8% |
99.4 |
+1.7% |
Apr 2024 |
117.9 |
-3.1% |
113.2 |
+0.5% |
126.6 |
-8.3% |
120.5 |
+0.2% |
98.8 |
+0.3% |
May 2024 |
118.2 |
-1.5% |
113.4 |
+0.7% |
127.2 |
-5.0% |
121.0 |
+1.0% |
98.0 |
-0.3% |
Jun 2024 |
118.6 |
-3.4% |
113.0 |
+0.6% |
129.0 |
-9.0% |
120.7 |
+0.3% |
97.7 |
-0.8% |
Jul 2024 |
117.6 |
-4.6% |
112.3 |
-0.3% |
126.5 |
-10.9% |
121.1 |
+0.2% |
97.4 |
-1.4% |
Aug 2024 |
119.2 |
-2.4% |
112.1 |
-0.2% |
131.3 |
-6.0% |
121.1 |
+0.5% |
97.7 |
-0.3% |
Sep 2024 |
118.5 |
-5.5% |
111.6 |
-0.4% |
129.4 |
-13.3% |
122.1 |
+1.7% |
97.2 |
-1.7% |
Oct 2024 |
117.5 |
-5.6% |
111.1 |
-0.6% |
126.6 |
-14.0% |
123.5 |
+3.1% |
96.1 |
-2.5% |
Nov 2024 |
118.2 |
-3.2% |
110.6 |
-1.1% |
128.4 |
-8.4% |
124.3 |
+3.8% |
96.6 |
-2.8% |
Dec 2024 |
120.5 |
-1.3% |
110.3 |
-2.6% |
135.1 |
-2.6% |
124.7 |
+3.8% |
96.6 |
-2.5% |
Jan 2025 |
114.2 |
-6.2% |
110.3 |
-3.1% |
116.5 |
-15.2% |
126.1 |
+4.8% |
96.3 |
-2.8% |
Feb 2025 |
117.8 |
-2.0% |
110.3 |
-2.7% |
126.5 |
-5.1% |
127.0 |
+6.2% |
95.2 |
-4.4% |
Mar 2025 |
118.7 |
-0.5% |
110.4 |
-2.4% |
128.5 |
-1.4% |
127.2 |
+5.7% |
96.1 |
-3.3% |
Apr 2025 |
119.3 |
+1.2% |
110.3 |
-2.5% |
130.2 |
+2.9% |
127.8 |
+6.1% |
95.8 |
-3.1% |
May 2025 |
119.0 |
+0.6% |
110.6 |
-2.5% |
128.6 |
+1.1% |
128.0 |
+5.8% |
96.3 |
-1.7% |
Jun 2025 |
119.6 |
+0.8% |
110.6 |
-2.2% |
129.9 |
+0.7% |
129.0 |
+6.9% |
96.3 |
-1.4% |
Jul 2025 |
119.9 |
+2.0% |
110.5 |
-1.6% |
130.7 |
+3.3% |
128.8 |
+6.4% |
96.9 |
-0.6% |
Aug 2025 |
119.5 |
+0.3% |
110.5 |
-1.4% |
129.1 |
-1.7% |
129.5 |
+6.9% |
97.4 |
-0.3% |
Sep 2025 |
119.8 |
+1.1% |
110.7 |
-0.9% |
129.9 |
+0.4% |
129.7 |
+6.2% |
96.9 |
-0.3% |
Oct 2025 |
119.2 |
+1.5% |
110.5 |
-0.5% |
128.2 |
+1.2% |
129.7 |
+5.1% |
97.7 |
+1.7% |
Nov 2025 |
121.1 |
+2.5% |
111.2 |
+0.5% |
131.6 |
+2.5% |
131.4 |
+5.7% |
98.8 |
+2.3% |
Dec 2025 |
118.6 |
-1.6% |
110.8 |
+0.4% |
123.9 |
-8.3% |
132.6 |
+6.3% |
99.4 |
+2.9% |
Jan 2026 |
122.1 |
+6.9% |
110.7 |
+0.4% |
134.4 |
+15.4% |
131.8 |
+4.5% |
99.7 |
+3.4% |
Feb 2026 |
121.5 |
+3.1% |
110.9 |
+0.5% |
132.6 |
+4.8% |
132.9 |
+4.6% |
97.4 |
+2.3% |
Mar 2026* |
121.3 |
+2.2% |
110.7 |
+0.3% |
131.5 |
+2.4% |
133.4 |
+4.8% |
98.3 |
+2.3% |
Apr 2026* |
121.5 |
+1.8% |
109.8 |
-0.4% |
133.4 |
+2.4% |
133.0 |
+4.1% |
97.4 |
+1.7% |
May 2026* |
121.2 |
+1.8% |
109.3 |
-1.2% |
133.0 |
+3.4% |
133.0 |
+3.9% |
97.4 |
+1.1% |
FAQ
Q: What is the Accounting Demand Index, and what does it actually measure?
The ADI is a monthly composite of four federal data series — high-propensity business applications, NAICS 5412 employment, average hourly earnings, and average weekly hours — combined and rebased to a 2019 baseline of 100. It measures demand pressure on the accounting profession, not firm revenue or profitability. When the index rises, the operating environment for accounting firms is strengthening. When it falls, pressure is easing.
Q: How accurate is it?
Against seventeen independent observations of firm-reported net client fee growth spanning fourteen calendar years and two survey systems, the ADI correlates at r = 0.75 with p = 0.0005. It has matched the direction of ten of eleven major economic turns since 2006, including the 2008 financial crisis, the 2020 PPP surge, the 2021 business-formation boom, the 2023 peak, and the 2024 cooling. The one miss — 2010 — was a margin call on a recovery that arrived slowly.
Q: Why does the ADI sometimes move in the opposite direction from IRS returns-per-worker?
Because they measure different things. The ADI measures demand pressure — what is coming at the profession. Returns-per-worker is throughput intensity — how much work existing staff are processing. When employment falls while return volume holds steady, throughput per worker rises even as underlying demand pressure eases. From 2023 to 2025 that is exactly what happened. The two metrics are related but they tell different stories, and treating them as equivalent produces the wrong conclusion.
Q: What is the December dip in the forecast, and should firms be worried?
No. The December 2026 forecast of ?1.6% year-over-year is a calendar artifact. December 2025 carried an unusually strong reading; the negative comparison is a function of that tough base, not a signal of demand collapse. The smoothed index holds above 122 through the entire forecast window, and January 2027 rebounds to +6.9% as the base effect reverses. The underlying trajectory from June 2026 through May 2027 is positive throughout except for that one month.
Q: Can a firm use the ADI to forecast its own revenue?
No, and that distinction matters. The index is national and profession-wide. The variance within any tier of the profession in any given year dwarfs the variance the ADI explains across the cycle. A firm growing 15% in a year the index reads flat is not contradicting the index — it is outperforming a trend. The ADI is a context-setter for conversations about workload, hiring, pricing, and capacity. It is not a firm-level planning tool.
Q: How does the ADI compare to the AICPA and Rosenberg MAP surveys?
The surveys and the index do different things and work best together. The MAP surveys capture firm-level realities — staffing ratios, compensation benchmarks, partner income, regional variation — that no national composite can reach. The ADI provides a monthly reading between the biennial AICPA publication and the annual Rosenberg publication, when the profession has no other current signal of where the cycle stands. Each ten-point rise in the ADI corresponds to roughly 1.1 percentage points of additional NCF growth in the surveys — which is why directional agreement between the index and the surveys is the right thing to check, not precision matching.
Q: How often is the index updated, and how reliable are the most recent readings?
The ADI is updated monthly, typically within two weeks of the BLS and Census releases that feed it. The most recent two to three months carry a provisional designation because BLS and Census regularly revise their preliminary figures. May 2026’s reading uses actual employment and business-formation data but carries forward April’s wage and hours figures, pending the July BLS release. Revisions are applied when final data arrive. Year-over-year and 12-month rolling readings are the most reliable; single-month readings carry roughly 2.9 points of one-standard-deviation noise and should not be used for turn calls.